Index:
- Salinity
- Salinity parameters and their values
- Guidelines for interpretation of water analysis
- General salinity management
3.1 Salinity
The strawberry is one of the most salt-sensitive crops cultivated by man. Salinity in the root zone radically decreases root development from the crown, water uptake, growth rate, and fruit yield. Salinity damage can be due to high concentrations of salts in the root zone, the accumulation of specific ions to toxic levels, or imbalances in ion ratios.
Symptoms of salt injury include dry and brown leaf margins, brittle leaves, stunted plant growth, and dead roots and plants. When salt toxicity is seen in localized areas in a field, it could be due to poor drainage. Symptoms can be seen throughout the field when salinity of the irrigation water is high. Excessive fertilization or application to wet foliage can also result in salt toxicity.
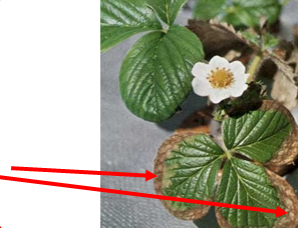
Figure 3.1: Salt injury symptoms in strawberry leaves: brown & brittle leaf margins
Source: Albert Ulrich, UC, 2009
3.1.1 General salinity
General salinity stress occurs when salts accumulate in the soil solution to a level where the strawberry plant can no longer extract ample water from the soil during growth. Salt-induced osmotic stress causes osmotic dehydration, which leads rapidly to a decrease in the water potential of cells and in cell volume (Levitt, 1980), and to a reduction in all vegetative and reproductive parameters, which finally is expressed by decimated yield. The amount of yield loss depends on the type and severity of salinity present, and the growth stage and length of time that the plant is exposed to the stress. Symptoms of salinity stress in strawberry plantings vary by variety, with the types and mixtures of salts involved, and as the severity of the problem increases. Mild salinity problems are frequently overlooked because plant size reduction and changes in plant color are uniform across the entire field. In general, however, advanced salinity initially causes a subtle change in foliar color, with plants becoming a darker bluish-green. As salinity stress increases, plant stunting becomes apparent and eventually leaves are burned at the tip and around the edges. Yield loss due to salinity problems is underway well before foliar symptoms become apparent.
As shown in Figure 3.2, yields decrease by 33%(!) for each EC unit increase in irrigation water salinity, above the threshold of 0.7 dS / m.
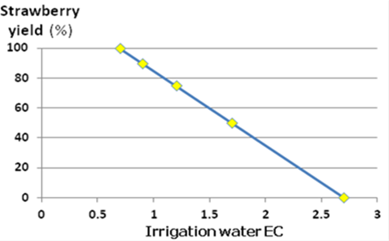
Figure 3.2: The effect of electrical conductivity (ECw) of irrigation water on strawberry yield, when soil was treated with less than 1% gypsum. Soil salinity extract (ECe) is generally 0.3 to 0.5 dS / m higher than the ECw.
Source: Wayne et al, 1991
The rate of potential yield loss due to increased salinity varies widely, depending on the strawberry variety, irrigation method, climate, soil conditions, and cultural practices. Where soils contain more than 1% gypsum, plants will tolerate about 2 dS / m higher soil salinity.
3.1.2 Chloride toxicity
If chloride ions (Cl-) are present in excessive amounts in the soil solution they can be toxic to strawberry plants. This toxicity stems from impairment of leaf metabolism. The photosynthesis is reduced and carbohydrate production is limited, which in turn result in a lower strawberry fruit yield and quality loss. High Cl- has been shown in numerous crops to induce nitrogen deficiencies due to reducing nitrate (NO3+) uptake.
The maximum permissible chloride level in the soil solution in most cases is 5 to 7 meq / L, and it varies somewhat by variety (see Figure 3.3). The highest allowable chloride level in irrigation water is 3 to 5 meq / L. Chloride higher than 0.5% in the dry matter of the plant indicates chloride toxicity.
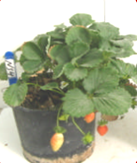
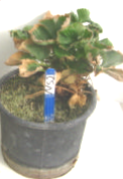
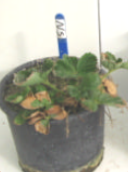
Figure 3.3: The effect of chloride on strawberry plants (cv. Selva)
Source: Khayyat et al, 2007
3.1.3 Sodium toxicity
If sodium ions (Na+) are present in excessive amounts in the soil solution they can be toxic to strawberry plants. Excessive sodium ions stemming from high-sodium salts in the soil solution may compete with calcium ions for membrane-binding sites. This not only reduces Ca2+ uptake, but reduces Ca2+ transport and mobility to growing regions within the plant, which affects the quality of both vegetative and reproductive organs. Salinity can directly affect nutrient uptake. Similar effects take place in the context of potassium uptake. Potassium deficiencies have been shown to stem from excessive sodium in numerous vegetable crops.
The sodium adsorption ratio (SAR) of the soil rates the danger to plants, based on the levels of sodium, calcium, and magnesium ions in the soil solution. Tables 3.1 and 3.2, following, give the formula used to calculate SAR, and information for evaluation of the SAR. Sodium higher than 0.2% in the dry matter of the plant indicates sodium toxicity.
Strawberries (and other salinity-sensitive crops) irrigated with water rich in calcium, magnesium, and sulfate ions tolerate higher sodium levels than plants watered with lower concentrations of Ca, Mg and SO4, even when they have same ECw. The reason for this is the counteracting effects of Ca and Mg on the sodium cations.
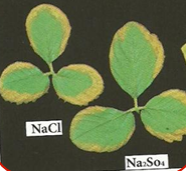
Figure 3.4: Sodium toxicity symptoms on strawberry leaves
3.1.4 Management of sodium- and chloride-toxicity in strawberries
As a result of the knowhow accumulated in many other crops grown under salinity conditions, it has been clearly shown for strawberries, too that the application of potassium fertilizers specifically combats excessive sodium in the soil solution. Similarly, the application of nitrate fertilizers specifically combats excessive chloride in the soil solution.
The study of Kaya et al, in Turkey, has established this effect very clearly on Oso Grande and Camarosa strawberries, in sand culture, as shown in Figure 3.5.
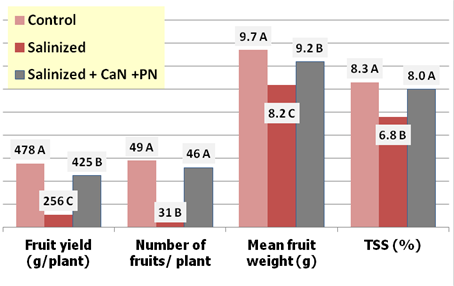
Figure 3.5: The effect of salinization and of counteracting it with potassium nitrate (PN) + calcium nitrate (CN), on most important fruit parameters of Oso-grande strawberries
Source: Kaya et al, 2003
Treatments were Control (nutrient solution alone), Salinized (nutrient solution + 35mM NaCl), and Salinized + 5mM CaN (calcium nitrate) + 5mM PN (potassium nitrate). The plants grown at high NaCl had markedly and statistically less dry matter, fruit yield, and chlorophyll content than those grown in normal nutrient solution for both cultivars. Both supplementary CaN and PN treatments significantly ameliorated the negative effects of salinity on plant growth and fruit yield. Moreover, in the cases of fruit numbers and TSS, the amelioration treatment revamped the plant performance to the rate of the control treatment with no significant difference between the two.
Sodium concentration in plant tissues increased in both cultivars in the NaCl treatment. Leaf concentrations of calcium, potassium, and nitrogen were much lower in plants grown at NaCl than those in the control treatment. Concentrations of these three nutrients were all significantly increased by both individual supplements, but were generally highest, in some cases very close to control values, in the salinized + CaN + PN treatment.
3.1.5 Boron toxicity
Boron is an essential nutrient for the plants. However, where present in excessive amounts, it is extremely toxic. It is present in irrigation water as un-ionized boric acid, expressed as boron element (B) in milligrams per liter. Boron concentrations lower than 0.7 mg / L will not affect plant performance. At concentrations of 0.7 to 3 meq / L, plant performance will be slightly affected, while at concentrations greater than 3 meq / L, plant performance will be severely affected. Boron tends to accumulate in the leaves until it becomes toxic to the leaf tissue and results in the death of the plant. In arid regions, boron is considered the most harmful element in irrigation water.
Studies and observations of various crops have shown that application of nitrates can defy the uptake of boron.
3.1.6 Water quality
The evaluation of the quality of irrigation water is based on laboratory tests. Laboratory determinations needed to properly evaluate irrigation water are listed in Table 3.1. The interpretation of laboratory irrigation water evaluations are based on the general rules in Table 3.2.
Salinity caused by irrigation water
Salinity problems in strawberry production are usually caused by salty irrigation water. To illustrate this claim let's quantify the problem.
Growers frequently apply 4,000 mm or more water per year to grow strawberries. This amount of water has a mass of 40,000 metric tons (MT). Let's assume that this water contains as little as 736 ppm total dissolved solids with EC=1.15 dS / m. Hence, the total amount of salts applied to one hectare equals 40,000 * 736ppm = 29.4 MT of salts each year!
Table 3.1: Salinity parameters and their values
Source: Wayne et al, 1991
Symbol | Units | Usual range | |
Total salt content | |||
Electrical conductivity | ECw | dS/m | 0 – 3 |
Total dissolved solids | TDS* | mg/L | 0 – 2,000 |
Specific ions | |||
Calcium | Ca2+ | meq/L | 0 – 20 |
Magnesium | Mg2+ | meq/L | 0 – 5 |
Sodium | Na+ | meq/L | 0 – 40 |
Carbonate | CO3- | meq/L | 0 – 0.1 |
Bicarbonate | HCO3- | meq/L | 0 – 10 |
Chloride | Cl- | meq/L | 0 – 30 |
Sulfate | SO42- | meq/L | 0 – 20 |
Nutrients | |||
Nitrate- nitrogen | NO3-N | mg/L | 0 – 10 |
Ammonium- nitrogen | NH4-N | mg/L | 0 – 5 |
Phosphate- phosphorus | PO4-P | mg/L | 0 – 2 |
Potassium | K+ | mg/L | 0 – 2 |
Miscellaneous | |||
Boron | B | mg/L | 0 – 2 |
Acidity | pH | 1– 14 | 6.0 – 8.5 |
Sodium adsorption ratio** | SAR | n.a. | 0 – 15 |
*Totaldissolved salts (TDS) of the water is a parameter directly related to ECw as follows:
TDS (mg/L) = ECw (dS/m)x 640
Hence: The higher the ECw value of the water, it is more restrictive to strawberries.
**SAR is calculated by the values of Na, Ca, and Mg, expressed in meq/L by the following formula:
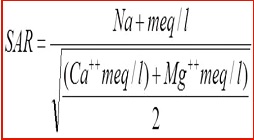
Table 3.2: Guidelines for interpretation of water analysis
Problem | Units | Restriction on water use | ||
None | Mild | Severe | ||
Salinity (affects plants ability to take up water) | ||||
ECw | dS / m | <0.7 | 0.7 – 3.0 | >3.0 |
TDS | mg / L | <450 | 450 – 2,000 | >2,000 |
Infiltration (affects water penetration rate into soil) | ||||
SAR = 0 – 3 and ECw= | <0.7 | 0.7 – 0.2 | >0.2 | |
SAR = 3 – 6 and ECw= | <1.2 | 1.2 – 0.3 | <0.3 | |
SAR = 6 – 12 and ECw= | <1.9 | 1.9 – 0.5 | <0.5 | |
SAR = 12 – 20 and ECw= | <2.9 | 2.9 – 1.3 | <1.3 | |
SAR = 12 – 40 and ECw= | <5.0 | 5.0 – 2.9 | <2.9 | |
Specific ion toxicity (affects the plants differentially) | ||||
Sodium (Na+) | ||||
Surface/drip irrigation | SAR | <3 | 3 – 9 | >9 |
Above canopy irrigation | meq / L | <3 | >3 | |
Chloride (Cl-) | ||||
Surface/drip irrigation | meq / L | <4 | 4 – 10 | >10 |
Above canopy irrigation | meq / L | <3 | >3 | |
Boron (B) | mg / L | <0.7 | 0.7 – 3.0 | >3 |
Other effects | ||||
Nitrogen (NO3-N) | mg / L | <5 | 5 – 30 | >30 |
Bicarbonate (HCO3) | me / L | <1.5 | 1.5 – 8.5 | >8.5 |
pH Normal range | 6.5 – 8.5 | |||
3.1.7 General salinity management
Drainage
The proper preparation of soil and beds before planting is essential for successful strawberry production.
Adequate drainage is required to accomplish the leaching, which is necessary to remove excess salts from the root zone. Perched water tables, compaction layers, and stratified or layered soils can upset the attempts to do proper leaching. Deep (30 inch) subsoiling and chiseling temporarily alleviate these problems, but must be repeated regularly (every 1 to 4 years, depending on conditions).
Deep plowing, which mixes the soil more completely, can alleviate drainage problems for longer periods in many cases. Drainage canals and tile drain systems should be installed where high water tables inhibit drainage. Care should be taken to avoid forming hard pans.
The addition of organic amendments to heavy soils to increase drainage is helpful in some cases. However, care should be taken in selecting the types and sources of amendments since many organic amendments contain salts that can significantly increase the salt load of the soil. Applying manures or compost within a year of planting strawberries is not recommended. Cover- or green-manure crops should be incorporated into the soil early enough to be completely decomposed by the intended fumigation date.
High beds provide improved drainage. Increasing bed height may help to alleviate drainage problems. The strawberry plant has the ability to take water from any area within the root system where it can be most easily obtained.
Areas of the root zone which have lower salinity levels supply more water to meet plant needs than areas with higher salinity levels. It is essential to establish a large root system and an adequate wetted area.
Measuring water quality
Sampling the irrigation water 2 to 4 times a year is recommended if salinity is suspected. Every off-value from the parameters shown in Table 3.1 and Table 3.2 should be considered a potential risk to obtaining a good commercial strawberry yield.
Patterns of salinity buildup in the soil
Salts that contribute to salinity problems are readily soluble and move with water in the soil. Salt content of the root zone varies with depth and distance from the point in the soil where water is applied. Salinity near the application point of irrigation water is usually close to the salinity of the irrigation water. Each irrigation session pushes salts deeper into the root zone, where they accumulate until they are leached. With drip irrigation systems installed near the surface in homogeneous soils, water tends to make a deep heart shaped wetted area in the soil. Salinity is highest at the edges of the wetted area and lowest near the point of water application (i.e., nearest the drip line). The salinity gradient within the wetted area and at the bottom of the heart shape will depend on the amount and frequency of leaching.
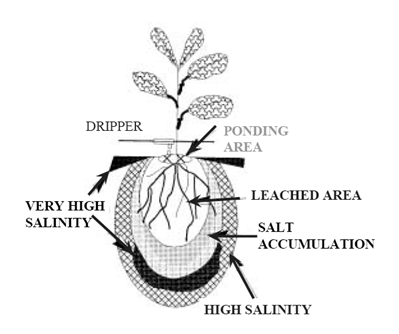
Figure 3.6: Soil, water and salt distribution in soil with a drip irrigation system
Source: Bravdo, 2007
Monitoring soil salinity during the season
Soil solution access tubes, which resemble tensiometers without a gauge, can be used to sample the soil solution during the season and monitor soil salinity. Salinity field testers are available to quickly process samples on the farm. Proper placement of the porous cup of the access tube in relation to the fertilizer band and drip irrigation line is critical in getting readings, which are a reasonable estimation of the average soil salinity of the root zone. Halfway between the plant row and the drip irrigation line and 20 cm (8 inches) below the surface, or at the same depth as the fertilizer band, appears to be one of the most favorable positions. Depending on cultural practices, however, other placements may be more desirable.
On four-row beds, two tubes should be placed to take samples both inside and outside the drip lines. An average of the two readings will give the best indication of an average salinity within the root zone. Samples should be taken midway between irrigation sessions. In other words, if irrigations are on a three-day rotation the samples should be taken a day and half after an irrigation session.
Leaching
Each irrigation session adds salts to the soil. The crop removes water from the soil to meet its needs but leaves most of the salts behind. This excess salt must be removed from the root zone before increasing to a level that affects yield. Salt is removed from the root zone by applying sufficient water so that a percentage of the total applied water percolates through and below the entire root zone, carrying with it some of the accumulated salts. The percentage of water applied above the amount necessary to meet evapotranspiration (ET) requirements is called the leaching fraction. Leaching requirements (LR) for drip-irrigated strawberry fields can be calculated using the following formula, if the irrigation-water salinity (ECw), soil salinity (ECe), and the estimated crop tolerance to soil salinity are known.
ECw
LR = ---------------------
5 * ECe – ECw
Example of estimating leaching requirement:
Given: total dissolved solids (TDS) of the irrigation water are 1000 ppm.Hence, ECw= 1000/640 = 1.56.
If the required yield potential is 75%, then Figure 3.2 suggests that ECe should not exceed 1.8. Using the formula above will show that the leaching fraction is 21%, meaning that the leaching treatment should be done by applying at the specific irrigation session 21% above the normal rate.
1.56 1.56
LR = ------------------------- = --------------- = 21%
5 * 1.8 – 1.56 7.44
The amount and frequency of irrigation should be calculated appropriately, to allow sufficient leaching while avoiding excessive soil moisture, which could cause other problems.
Drip irrigation technology in strawberry production with plastic mulch and frequent irrigations keeps the soil moist and very near to, or slightly above water holding capacity. Where salinity is a problem, irrigations should maintain a nearly continuous and slow downward movement of water and salts in order to maintain optimal salinity control. Monitoring the soil salinity throughout the season helps to maintain proper soil salinity levels and avoid salinity stress, which can easily go unobserved.
Leaching associated with the use of solid set sprinkler irrigation systems, before bed preparation or after transplanting and prior to putting plastic mulch over the beds, is an important part of establishing the planting. Sprinkler irrigation leaches salts away from the soil surface and the transplant crown, where salt can inhibit the adventitious root development necessary for the success of the planting. Rain water can be extremely helpful in decreasing salinity around plants during early growth if holes in the plastic are large enough to permit infiltration of the rain water around the plant.
The effect of fertilizers' salt index on salinity buildup
Nitrogen is the primary nutrient which needs to be supplied during strawberry production in most growing regions. Fertilizer placement is critical in strawberry plantings because of the crop’s sensitivity to salinity. Direct root contact with fertilizer applications will stunt or kill strawberry plants. Fertilizer formulations vary in their effect on soil salinity because various types of fertilizers, formulations, and blends have different solubility values. Most nitrogen and potassium fertilizers are very soluble and have high salt indexes (i.e., they dissolve rapidly and have an immediate impact on the salinity of the soil solution). Fertilizers with higher salt indices are more likely to cause general salinity problems, and to stunt or burn plants if placed close to the plant's root system at high rates. Most phosphate fertilizers are less soluble and have low salt indices. A fertilizer with a low salt index dissolves more slowly and is generally safer to place near plant roots. Low salt index materials have less of an immediate impact on general soil salinity.
Salt index numbers compare the solubility of fertilizers to highly soluble sodium nitrate, which has an index number of 100.
The index numbers of some fertilizer materials commonly used in strawberry production include ammonium nitrate = 104.7; urea = 75.4; potassium nitrate = 73.6; calcium nitrate = 52.5; and monoammonium phosphate = 34.2.
The salt index number is important for comparing fertilizers, but fails to take into account the difference in the nutrient analysis of various materials. For instance, urea contains 46% nitrogen by weight, ammonium nitrate contains 34% nitrogen, and calcium nitrate contains 15.5% nitrogen. Therefore, the partial salt index per unit of plant nutrient is a better measure of the material’s impact on salinity, based on the number of units of nutrient that must be applied in a season. In other words, a material that has a high salt index and a high analysis will have less impact on the salinity of the soil solution than a water soluble material that has a low analysis. The low analysis material has other non-nutrient ions that also add to the salt load.
The partial salt index per unit of plant nutrient for ammonium nitrate = 2.99, calcium nitrate = 4.41, and urea = 1.62. Therefore, if a given amount of nitrogen is to be added to the soil and salinity is the only consideration, urea would be the best material because it would have the least impact on salinity.
Fertilizer placement for winter strawberry plantings
Controlled-release fertilizers (CRFs, resin-coated fertilizers) are often banded in a planting slot 15 cm to 20 cm (6 inches to 8 inches) deep (see Figure 3.8). The fertilizer band is covered with approximately 4 cm (1½ inches) of soil and transplants are placed directly above the fertilizer band. Direct contact of transplants with the fertilizer band should be carefully avoided. Supplemental applications of nitrogen as ammonium nitrate or urea are made through the drip irrigation system during the first three months of the season.
Supplemental application rates and timing are based on climatic conditions and the observed needs of the plants. This placement of the fertilizer in a slot below the transplant, with the drip irrigation line above and between rows of plants, creates a gradient of salinity (salinity being lowest near the drip line and highest within or just below the fertilizer band). This gradient allows the strawberry roots to grow into areas of minimum salinity for optimal water uptake and also to selectively grow into fertilized soil of higher salinity, in which the plant can best take up needed nutrients. This appears to be the best method for applying fertilizers to strawberries in areas where water quality is low and salinity is a serious problem. Read more about the details and the advantages of this fertilization system in paragraph 6.2 of this publication: Controlled-release nutrition of strawberries.
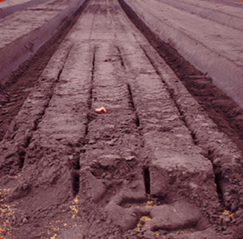
Figure 3.7: CRF placement in deep slots during the preparation of the growing beds
California, USA, 2004
Summer strawberry plantings
In summer plantings all of the lime, gypsum, phosphorous, and any potassium or minor elements that are to be applied, plus a portion of the total nitrogen, can be broadcast and incorporated into the soil that will make up the bed. Side dressing the nutrients in bands below and to the outside of the planting slots is also utilized in summer plantings. Additional nitrogen is often applied through the drip irrigation system during the growing season. If controlled / slow-release fertilizers are used, they are placed at the bottom of the planting slot below the roots, and covered with approximately 4 cm (1½ inches) of soil, to the side of the slot, or in the middle of the bed under the drip irrigation line (see Figure 3.8 below, and Figure 6.6 on page 101.
More fertilizer placement options are available to growers with summer plantings. The same concern should be exercised, however, for salinity control and monitoring of salinity levels to insure optimal yields.
Need more information about growing strawberries? You can always return to the strawberry fertilizer & strawberry crop guide table of contents (see more strawberry ph).


